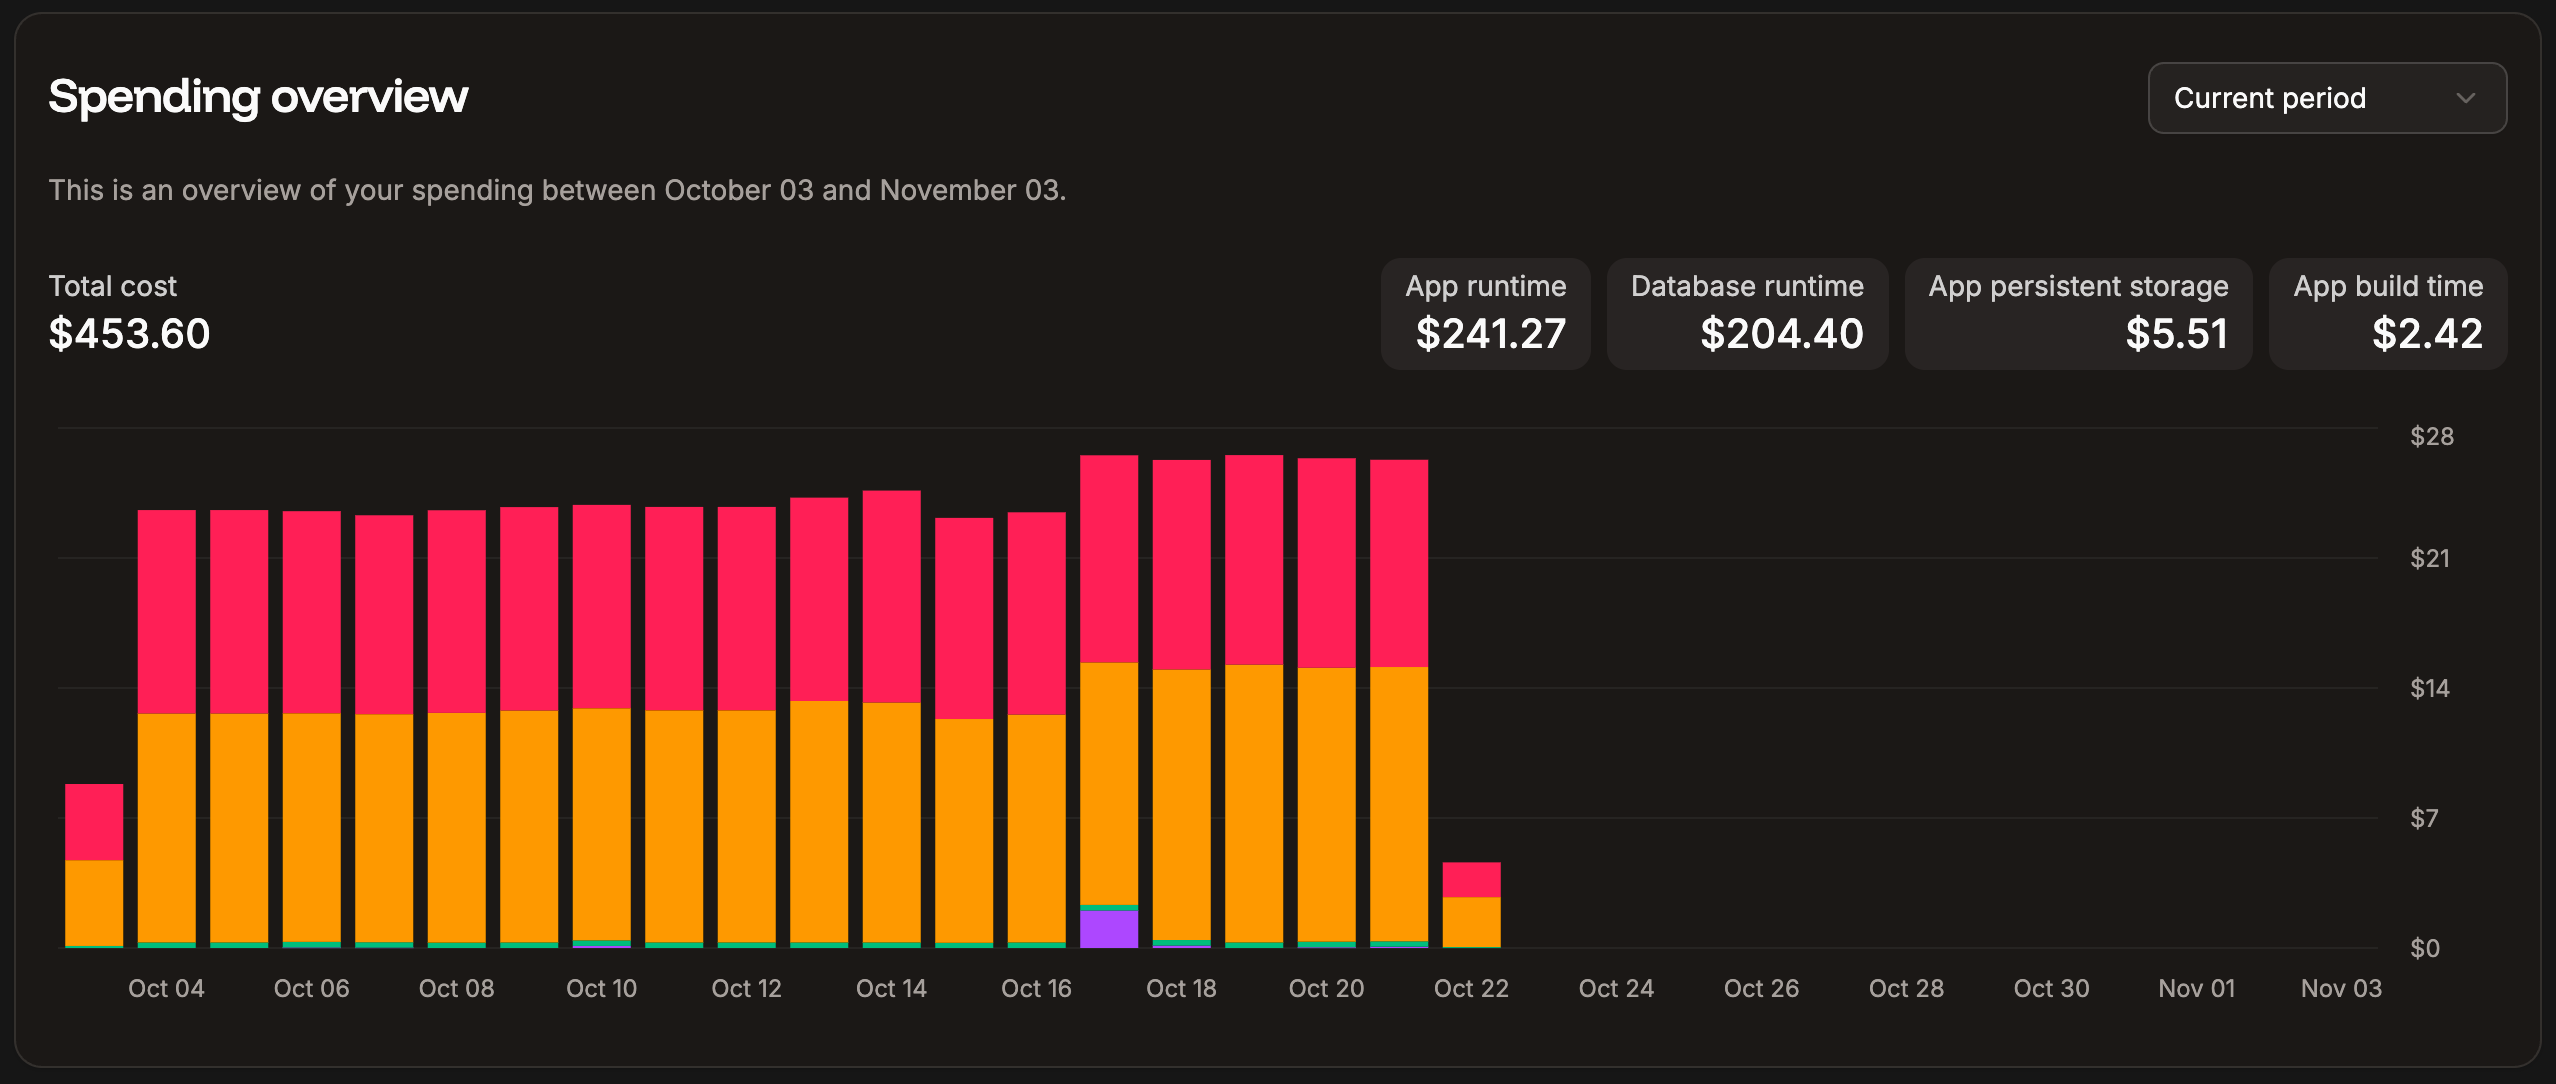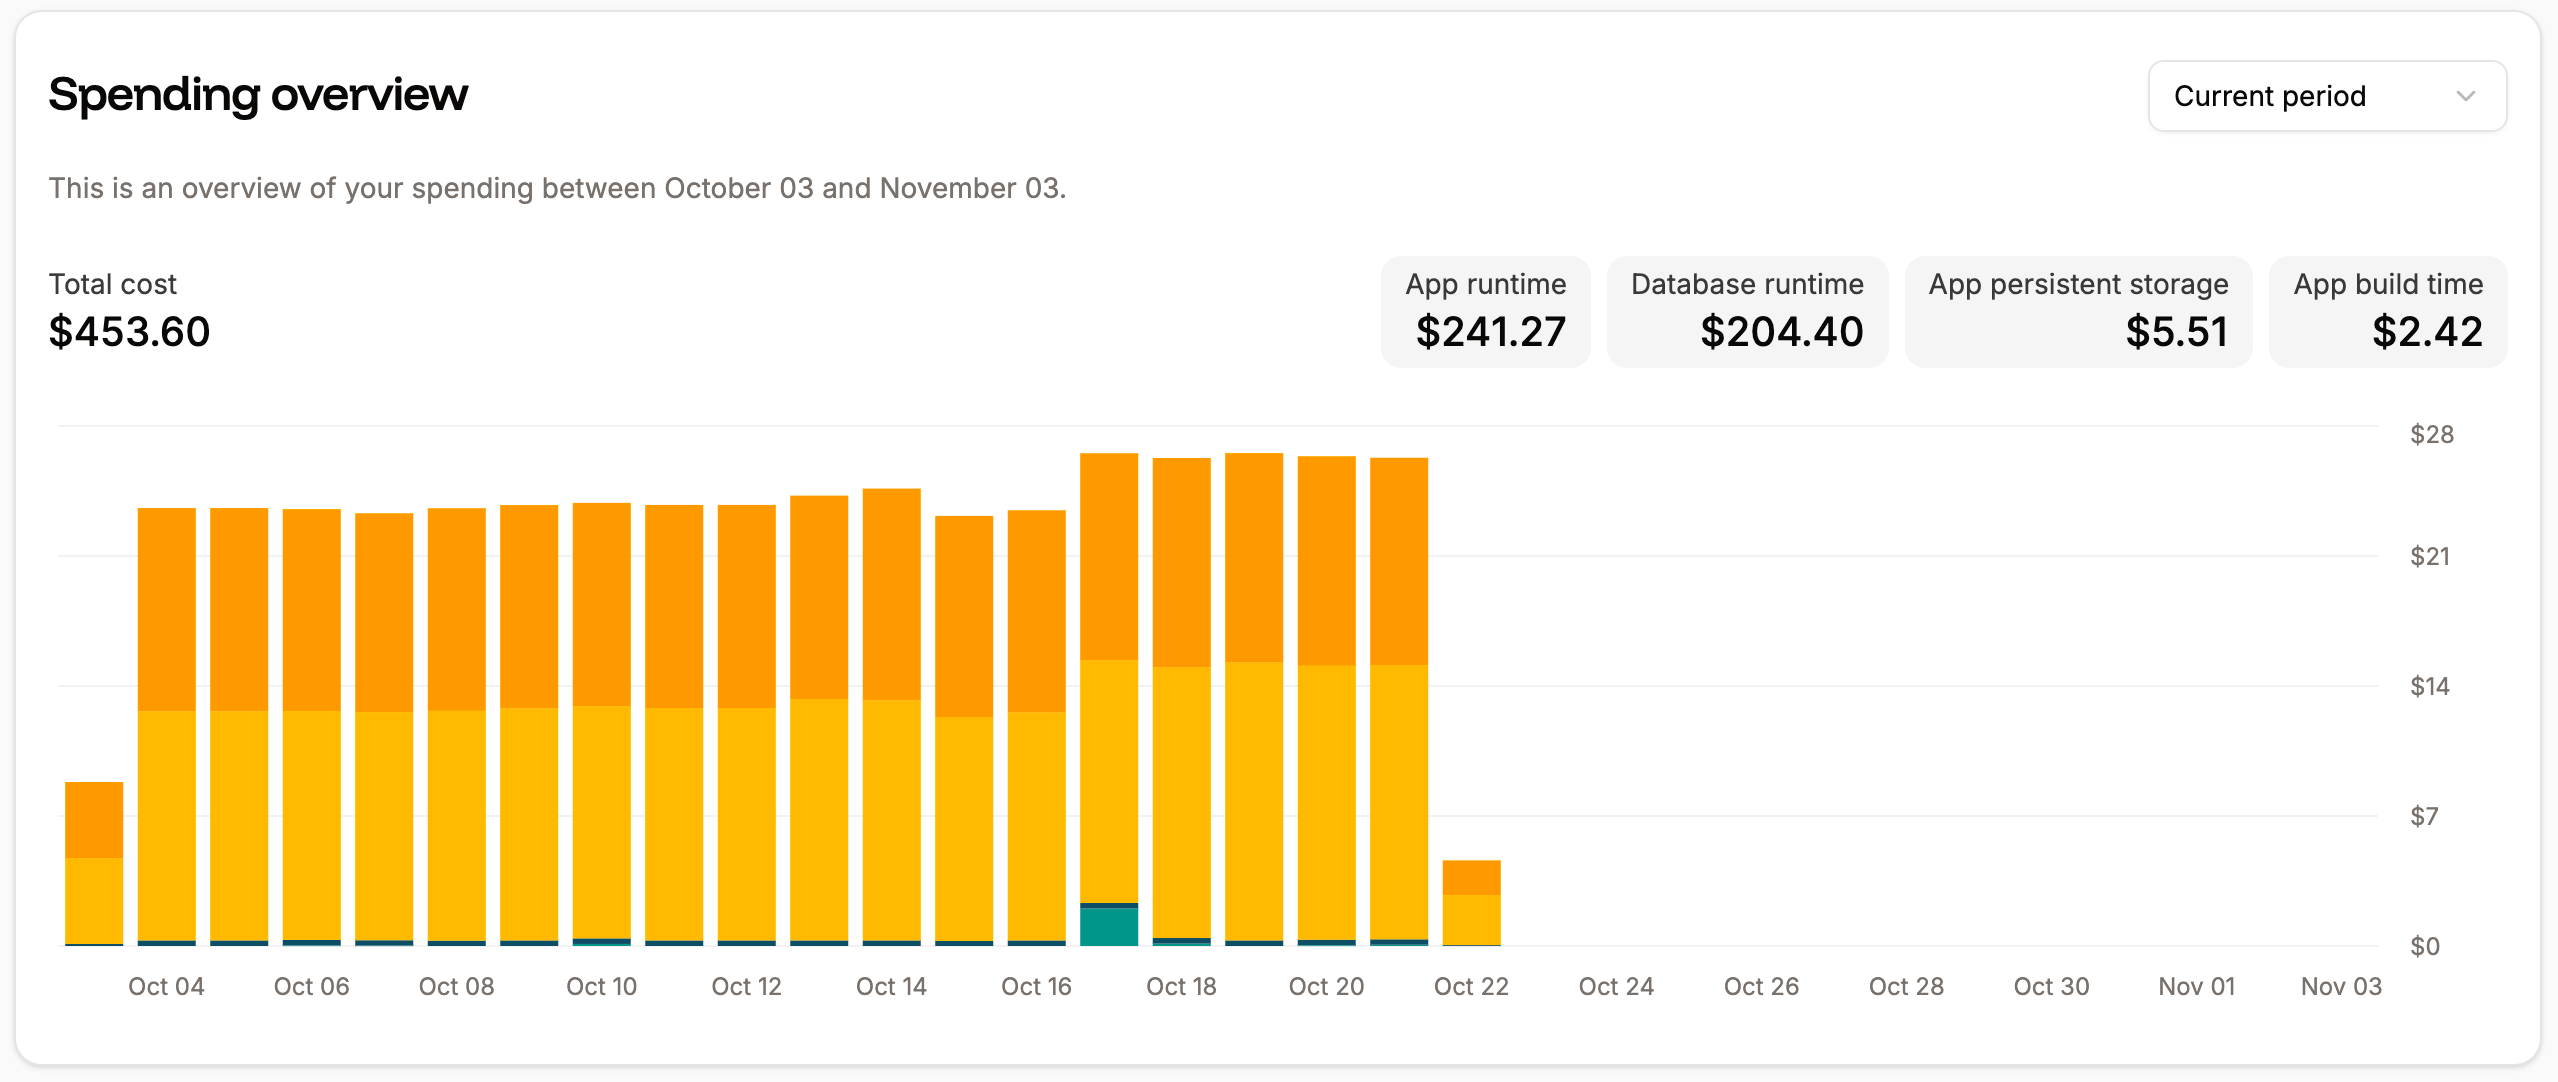
Spending overview for your Sevalla services on your Sevalla Dashboard.

Static site Analytics page.
Requests per minute
The Requests per minute chart shows the average number of HTTP requests per minute (RPM) of all HTTP requests for the time period selected.
Requests per minute chart.
Response time
The Response time chart shows the average response time for all HTTP requests for the time period selected.
Response time chart.
Slowest requests
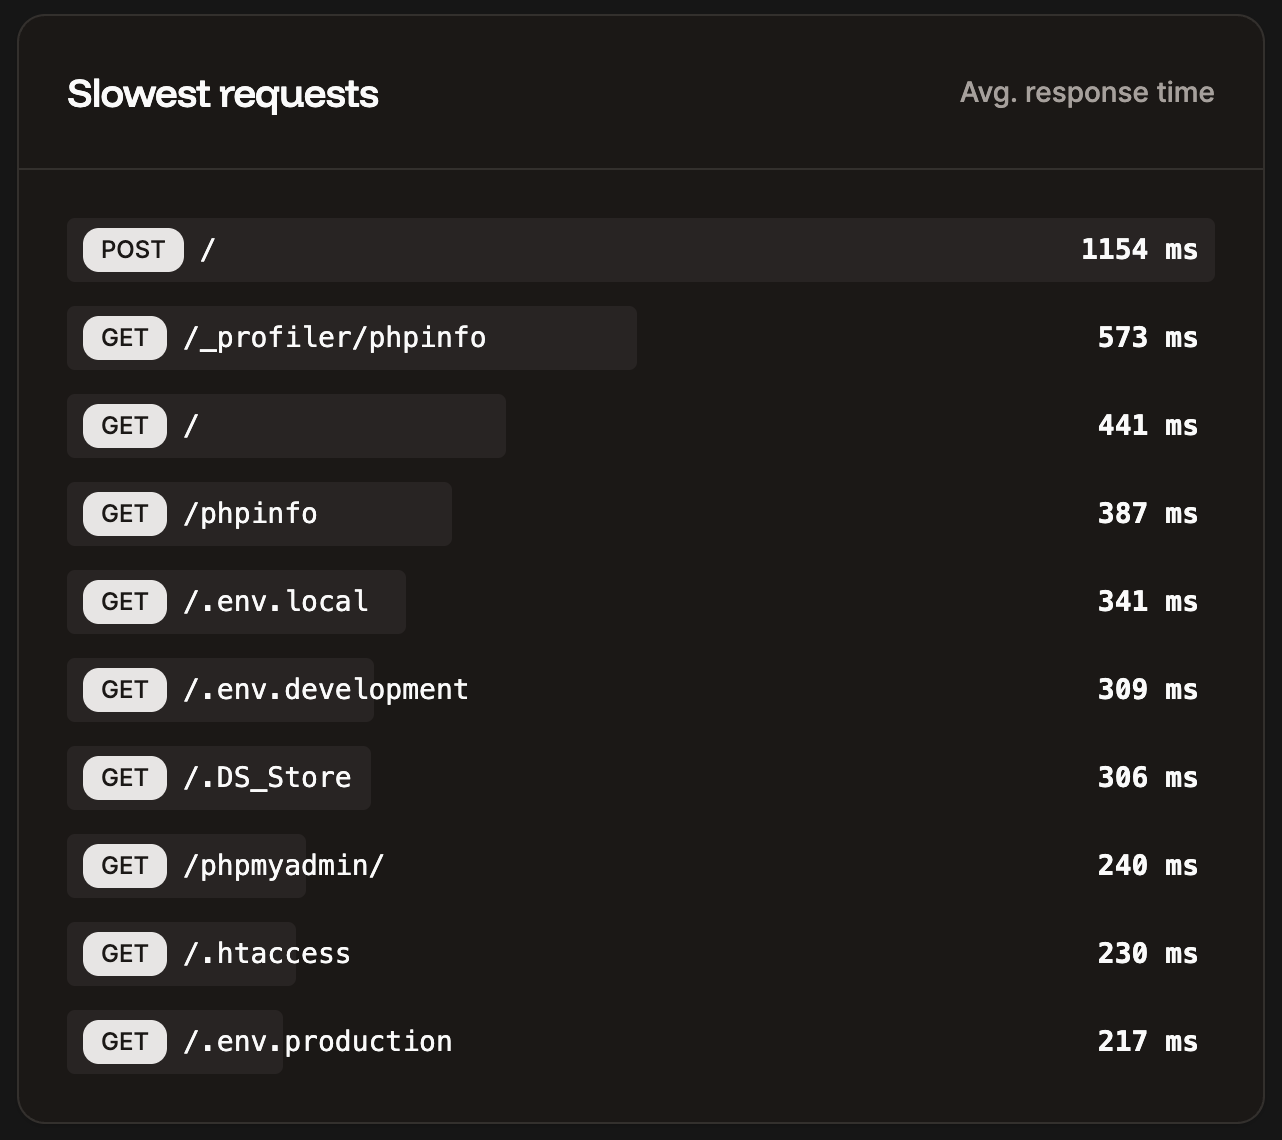
The Slowest requests table shows the 10 slowest requests to your site for the selected time period and the average response time it took to complete.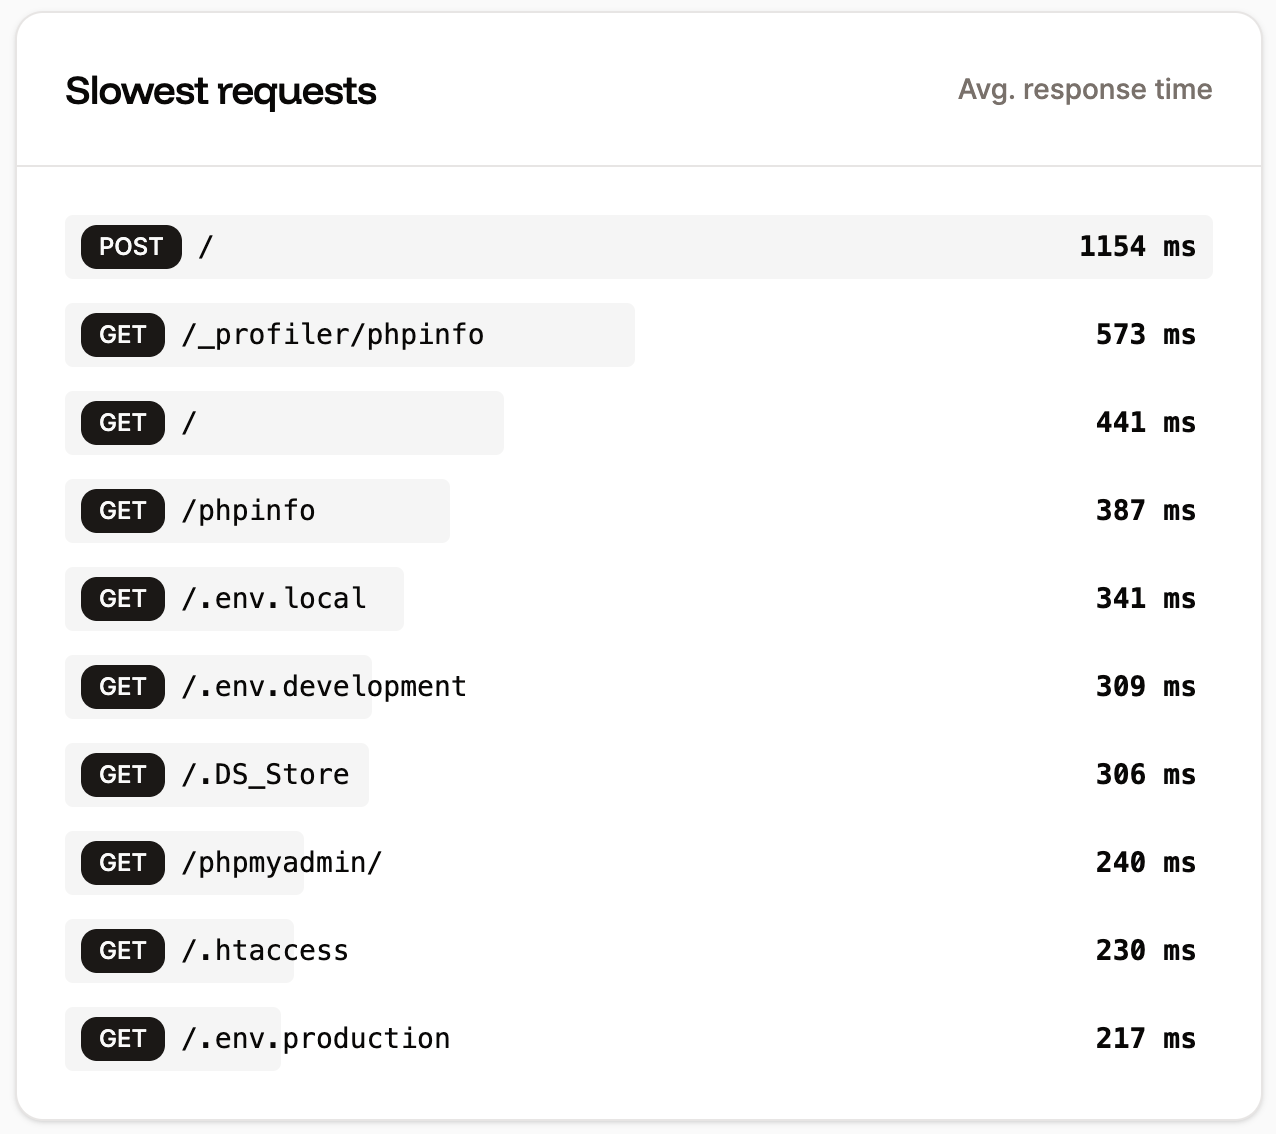
Slowest HTTP requests table.
Top paths
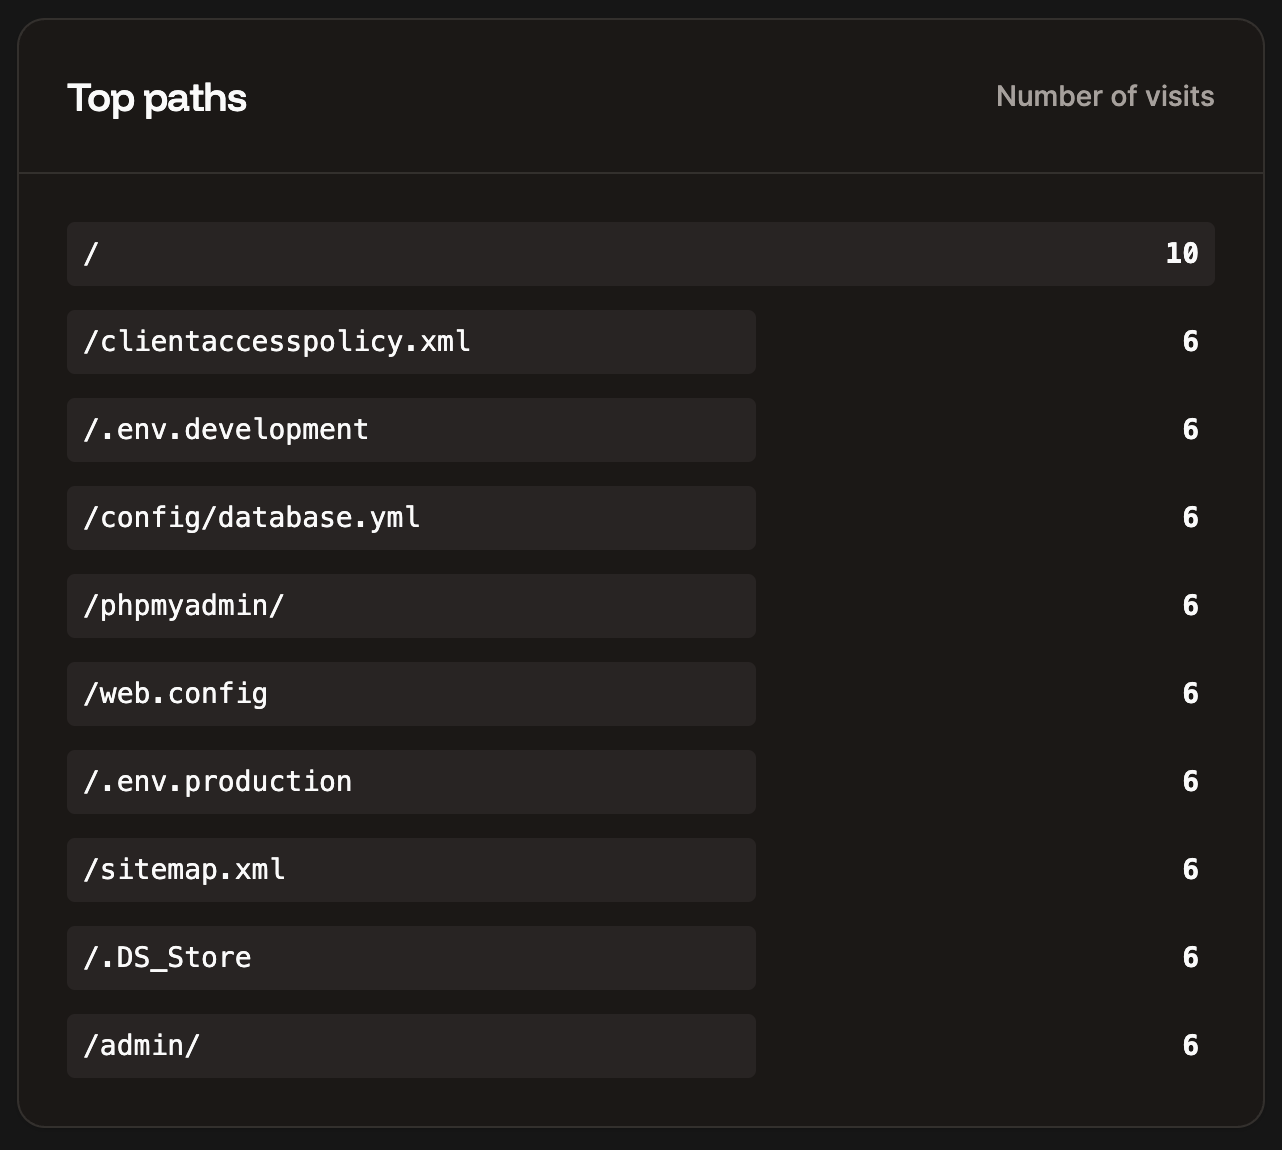
The Top paths table shows the top 10 most requested paths by the number of views for your site.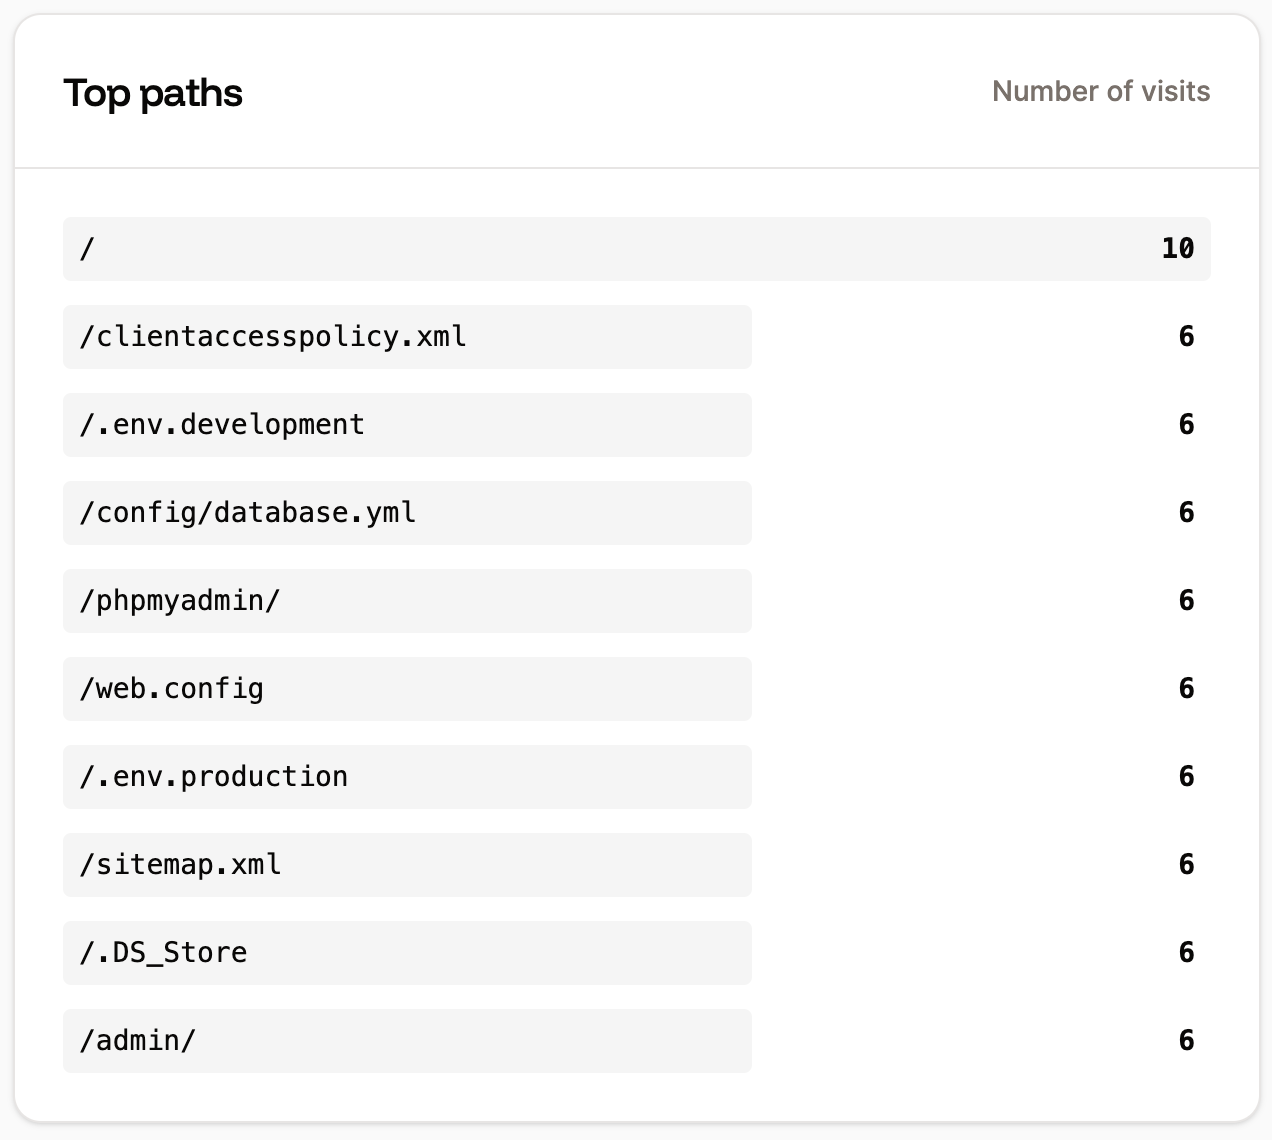
Top paths requests table.
